
4-7-1: Drawing a Grid
Chapter 4: Display
|
4-7: Grids and Alignment 4-7-1: Drawing a Grid |
|
The Toggle Grid command (in menu Window) turns the grid display on and off. The grid consists of dots at every grid unit, and bolder dots every 10 units, but both of these distances are settable.
The size of a grid unit can be related to real-world distance by considering the scale of the technology. For example, in the MOSIS CMOS technology, the scale is 0.2 microns, as shown in the status area. When the grid is displayed, the dots are therefore 0.2 microns apart. For more information on scaling, Section 7-2-1.
Note that the grid display changes as you zoom in and out. When zoomed too far out to show all of the dots, only the bolder dots are shown. When zoomed too far out to show even the bolder dots, the grid is not displayed. However, the fact that the grid should be on is remembered, so it reappears when you zoom back in. Use the Make Grid Just Visible command (in menu Window / Special Zoom to change the zoom factor so that the grid is minimally visible.
| The Grid Preferences (in menu File / Preferences..., "Display" section, "Grid" tab) presents a dialog in which grid dot spacing may be set. You can change the grid spacing for the current window, and also set a default grid spacing to be used in new windows. The grid spacing is also used by arrow keys when they move objects (see Section 2-4-1). | 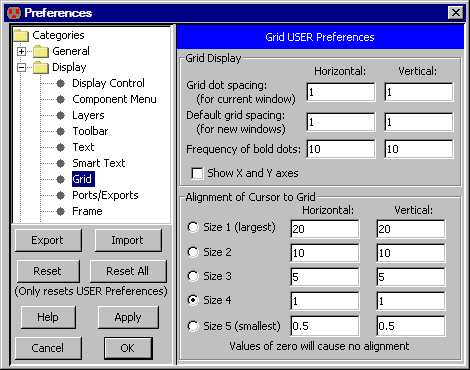 |
Additional grid graphics are available, such as the display of bolder grid dots and the drawing of coordinate axes. When the X and Y axes are shown, they pass through the cell center.
 |
Previous |  |
Table of Contents | Next |  |