 |
10-2: Simulator Operation |
|
|
10-2: Simulator Operation |
|
When simulation begins, a waveform appears in a new window which is highlighted with a red border. The circuit that is being simulated is also highlighted with a red border to indicate its association. Here is a sample waveform window when attached to the built-in ALS simulator:
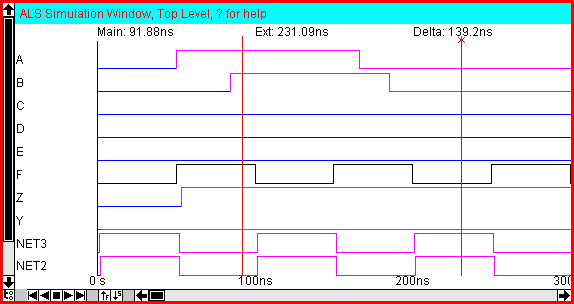
In the main waveform window, Exports and other network names are listed on the left (if there are too many, then the slider allows them to be scrolled into view). The dividing line between signal names and signal values can be grabbed and moved to make room for wider signal names. You can click over a signal name or the actual waveform to select it for appropriate operations. Note that when you click on a signal, the equivalent network in the associated schematic or layout window is also highlighted.
You can rearrange the order of the signals by dragging their names to their desired location. You can remove a signal by selecting it and typing the letter "r" (or the DELETE key). You can add a signal to the list by typing the letter "a" (you will then be prompted for the signal to add). If you are in the associated layout or schematics window and type "a", then that network is added. To aggregate a number of signals into a single "bus" signal, select them and type "b" (to select multiple signals, start in the blank space between signal names and drag vertically over multiple names). Once a bus signal has been created, its individual signals can be shown or hidden by double-clicking on its name. All of these rearrangements are remembered with the cell for subsequent simulations. With the ALS simulator, you can use the Restore Signal Display Order (ALS) subcommand to reset the waveform display to its original set of signals. With all simulators, you can use the Remove Signals Saved with Cells subcommand to clear the saved list of rearrangements.
Two vertical cursors appear in the window, called "main" and "extension" (the extension cursor has an "x" at the top). You can click over the cursors and drag them to different time locations. If one signal is selected, its value is shown at the main and extension times.
The time axis of the simulation window can be controlled with the appropriate Window menu commands. Use Zoom Out and Zoom In to scale the time axis by a factor of two. Use Focus on Highlighted to display the range between the main and extension cursors. Use the Cursor subcommand of the Center command to shift the time to the location of the cursors.
The bottom of the waveform window has a set of VCR buttons that control an animation of the time. The Play rate can be controlled by the "F" and "S" buttons which make it go faster or slower. In addition, since the waveform window can light-up special "simulation probe" nodes, the VCR can be used to animate activity on a chip (see the section on "Simulator Control" below for more on this).
When a signal name is selected, a test vector can be placed on that signal at the time specified by the main cursor. Type "l", "h" or "x" to set the signal to low, high, or undefined (using normal strength, shown in magenta). For bus signals, type "v" (you will then be prompted for the value to set on that bus). Prefix the letter with a "w" ("wl", "wh", "wx", and "wv") to set a weaker strength signal (shown in green). Prefix the letter with an "s" ("sl", "sh", "sx", and "sv") for stronger strength signals (shown in black).
Another way to control the strength of signals is by setting a transistor's strength. You can use the Transistor Strength subcommands of the Simulation (Built-in) command of the Tools window to control a selected transistor. Note that this must be done before simulation begins.
To remove the test vectors on the selected signal, type the "e" key. Use the Clear All Vectors subcommand of the Simulation (Built-in) command of the Tools menu to erase all test vectors. Note that these commands do not remove "strong" vectors (those set with the "sl", "sh", "sx", or "sv" commands).
Once vectors are established, the Save Vectors to Disk subcommand of the Simulation (Built-in) command of the Tools menu will write this information to disk. Use the Restore Vectors from Disk subcommand to read it back. You can even use the Save Vectors as SPICE commands subcommand to dump this information as a SPICE deck.
In the ALS simulator, you can also obtain simulation data from an SDF file (with the SDF subcommand of the Import command of the File menu). Once this data has been read, one of three sets of values (Typical, Minimum, or Maximum) must be selected from the Annotate Delay Data (ALS) subcommand of the Simulate command of the Tools menu.
Besides simple test vectors, the ALS simulator can also set clock patterns on the currently selected signal by typing the letter "c". The user is then given a dialog for clock specification. Note that the clock may cycle infinitely, but Electric generates simulation events to fill only the current waveform window. If you want more clock events generated, zoom-out the waveform window before issuing the clock command.
There are three ways to specify a clock: by frequency, period, or with custom phases. If the frequency or period method is selected, the only option is the frequency (in cycles per second) or period (in seconds).
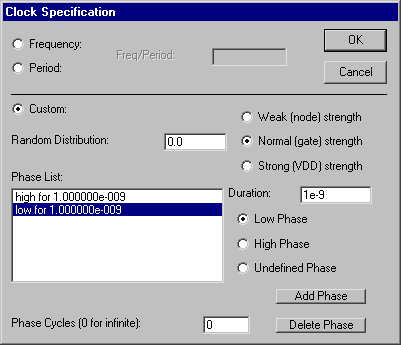 | If, however, custom clock specifications are requested, the entire lower part of the dialog is enabled (as shown on the left) and many options are available. You can choose the strength of the clock (node, gate, or VDD), the random distribution of the clock, and a list of phases that will be repeated a specified number of times (use 0 repetitions for an infinite clock). For each phase, select its level (low, high, or undefined) and its duration. Then use the "Add Phase" button to add it to the list. Use the "Delete Phase" button to remove a phase. |
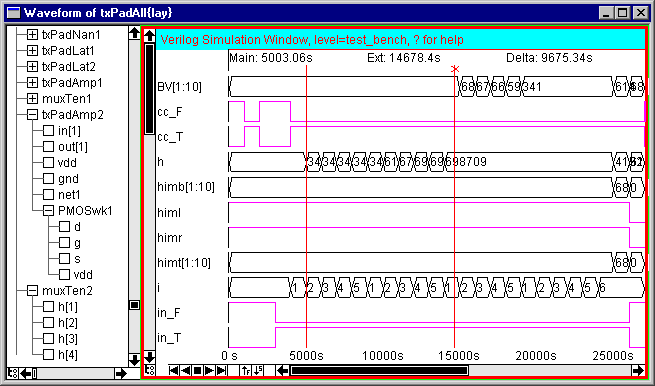
The simulators uses the hierarchy in the original circuit during simulation. Therefore, the signals shown are those from the current hierarchical level. If you use the Down Hierarchy and Up Hierarchy commands of the Cells menu to move through the hierarchy of the circuit, the waveform window will change to reflect the displayed circuitry.
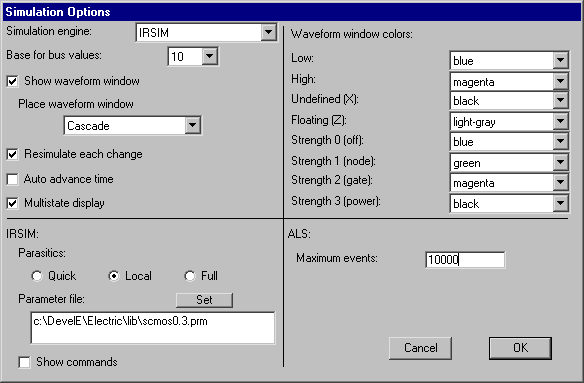
The Simulation Options... subcommand of the Simulation (Built-in) command of the Tools menu offers control over the simulation process. Each change that is made to the simulator causes it to resimulate and display the results. If multiple changes are to be made and the simulation time is long, uncheck the "Resimulate each change" item. Then you must type "u" when you want to resimulate.
 | The "Auto advance time" check tells the simulator to move the time cursor automatically when a new signal is added to the simulation. |
When simulating, the state of the circuit is displayed both in the waveform window and also on top of arcs in associated layout or schematics windows. The colors used can be controlled with choices in the upper-right part of the dialog.
The "Multistate display" check tells the simulator to show signals in the layout or schematics window with texturing and color to indicate strength. Without this, a simple on/off indication is drawn in the layout or schematics window. Keep in mind that the "Simulation Probe" node of the Generic technology also changes appearance to show simulation activity. You must connect it (with Universal arcs) to the part of the circuit that you want it to reflect. The Simulation Probe node is obtained by the Simulation Probe subcommand of the New Special Object command of the Edit menu.
The "Show waveform window" check tells the simulator to create a separate window with waveform plots when simulation starts. When this is unchecked, simulation still runs, but only displays signal information on the schematic or layout.
You can choose where you want the waveform window to be displayed. The default, "Cascade", requests that it appears in a new overlapping window. You can also request that the waveform window "Tile Horizontally" or "Tile Vertically", which causes the simulated circuit's window to split, showing the waveform in the other half.
For signals that are aggregated into busses, you can choose the number base for display of values.
The ALS simulator handles only a fixed number of events before it stops simulating (initially 10,000). If your circuit or analysis is too long, you will have to increase the number of events.
The IRSIM simulator only simulates for the range of time that is displayed. If you zoom out, you may have to modify the test vectors to force it to resimulate for the extra displayed time.
The IRSIM simulator can handle three levels of parasitic information: "Quick" makes quick estimates of area and perimeter; "Local" analyzes each level of hierarchy fully but separately; "Full" analyzes the entire hierarchy, and can take a long time. In addition, you can specify the ".prm" parameter file that you want IRSIM to use.
Besides the options offered by the dialog, there are some additional commands that can be typed to the waveform window. Use "t" (ALS only) to trace the simulation for the selected signal (and "ft" to dump a full trace of all signals). Use "i" to display information about the selected signal. Use "p" to preserve a snapshot of the simulation window in the database (a cell with the "simulation-snapshot" view is created with artwork components). To stop simulation, close the simulation window.
Here is a summary of the single-key commands available in digital simulation windows:
| l wl sl |
Set selected signal low at main cursor (gate strength) Set selected signal low at main cursor (node strength, weak) Set selected signal low at main cursor (VDD/GND strength, strong) |
| h wh sh |
Set selected signal high at main cursor (gate strength) Set selected signal high at main cursor (node strength, weak) Set selected signal high at main cursor (VDD/GND strength, strong) |
| x wx sx |
Set selected signal undefined at main cursor (gate strength) Set selected signal undefined at main cursor (node strength, weak) Set selected signal undefined at main cursor (VDD/GND strength, strong) |
| v wv sv |
Set a value on the selected bus signal at main cursor (gate strength) Set a value on the selected bus signal at main cursor (node strength, weak) Set a value on the selected bus signal at main cursor (VDD/GND strength, strong) |
| c | Specify a clock on selected signal |
| e | Delete all vectors on selected signal |
| i t ft |
Print information about selected signal Trace simulation for selected signal (ALS only) Trace simulation for all signals (ALS only) |
| b | Aggregate selected signals into a bus signal |
| a | Add signal to simulation window |
| r DEL | Remove selected signal from simulation window |
| p | Preserve snapshot of simulation window in database |
| u | Resimulate and redisplay the waveform information |
| ? | Print this help message |
These window menu functions apply to the digital simulation windows:
 |
Previous |  |
Table of Contents | Next |  |